
Overview:
Futures point to a positive open with S&P 500 contracts at 7,587.25 and Nasdaq 100 futures at 30,395.50, powered by the formal US-Iran deal signed at Versailles. The Fed's unanimous 12-0 hold at 3.50%-3.75% carried a sting: the dot plot showed nearly half of FOMC participants penciling in at least one hike, sending the 10-year yield to 4.49% and lifting the VIX 12.37% to 18.44. New Fed Chair Kevin Warsh announced five dedicated internal task forces, signaling a regime shift that traders are stil
NEW YORK — Equity futures are pointing higher Thursday morning, but a 12% spike in the VIX is asking a question the bulls would rather not answer.
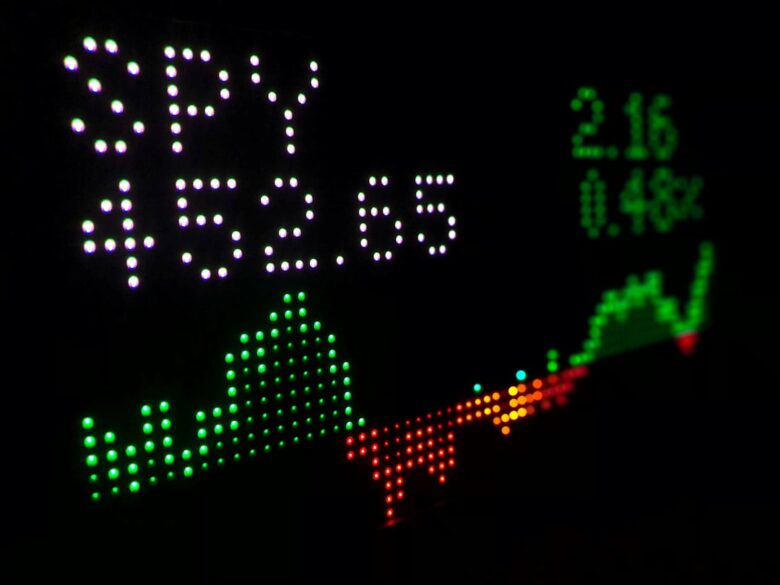
NEW YORK, June 18, 2026 — S&P 500 futures rose 0.83% to 7,587.25, Dow futures added 282 points to trade near 52,679, Nasdaq 100 futures climbed 1.32% to 30,395.50, and Russell 2000 E-Mini contracts edged up 0.32% to 2,973.80 — a broad-based premarket advance that looks, on the surface, like unambiguous risk-on. Beneath it, the VIX surged 12.37% to 18.44, the 10-year Treasury yield held at 4.49%, gold climbed to $4,304.85 an ounce, WTI crude fell 1.28% to $75.81 per barrel, and Brent dropped 1.12% to $78.66. That combination — equities up, volatility up, gold up, oil down — is not a clean risk-on tape. It is a market trying to price two contradictory forces at the same time: a landmark geopolitical agreement that removes a significant tail risk, and a Federal Reserve that just told the world it might still raise interest rates this year.
Two Forces, One Tape: Versailles Meets the Dot Plot
President Trump signed the 14-point US-Iran memorandum of understanding during a dinner at the Palace of Versailles, with Iranian President Pezeshkian signing separately in Tehran. The formal MOU removes one of the most persistent geopolitical risk premiums that has shadowed energy markets and broad equities for the better part of three years. Oil’s decline — WTI off 1.28%, Brent off 1.12% — reflects the removal of that supply-disruption premium in real time. Cheaper energy is a direct margin tailwind for airlines, industrials, and consumer discretionary. That explains at least part of Thursday’s futures pop.
But the Fed meeting, held Wednesday, delivered a message that complicates the narrative. The FOMC voted 12-0 to hold the federal funds rate at 3.50%-3.75%, a unanimous decision that sounds dovish until you read the Summary of Economic Projections. Nearly half of committee members indicated at least one rate hike may be warranted this year. That is not a hold. That is a conditional hold — and the market’s VIX reaction suggests traders heard the qualifier.
New Fed Chair Kevin Warsh used the occasion to announce five dedicated task forces covering communications, balance-sheet management, data usage, productivity and employment, and the Fed’s approach to inflation targeting. The structural ambition is notable. Warsh is not just inheriting Powell’s framework — he appears to be auditing it. As we examined earlier this week, Warsh may have already changed the Fed’s regime in a single press conference, and Thursday’s premarket reaction suggests the market has not fully priced what that means for the rate path through year-end.
Nikkei 71,000 and the Split in Global Risk Appetite
Japan’s Nikkei 225 crossed 71,000 for the first time in its history overnight, with the Topix reaching 4,069. The move reflects a confluence of forces that have nothing to do with the Iran deal: a weaker yen boosting export earnings, continued foreign inflows into Japanese equities, and a Bank of Japan that remains the most dovish major central bank on the planet. The Nikkei’s historic breakout is real and meaningful — but it should not be extrapolated as a global risk signal. This is a Japan-specific story.
Hong Kong’s Hang Seng told a different story, falling 2.2% — the sharpest overnight decline among the major indices tracked this morning. The divergence between Tokyo and Hong Kong captures the fault line running through Asian markets: Japan benefits from dollar strength and yen weakness; Hong Kong continues to face pressure from China’s uneven economic recovery and persistent outflows. Europe was similarly divided, with the DAX adding a modest 0.2% while the FTSE 100 lost 0.8% and the CAC 40 slipped 0.1%.
The European picture matters for US traders because the FTSE’s decline — despite the Iran deal removing Middle East risk — suggests that the oil price drop is cutting both ways. For energy-heavy indices like the FTSE, cheaper crude is not a gift. It is a revenue headache. The split between DAX gains and FTSE losses reflects exactly that tension: industrials and manufacturers cheer lower energy costs; energy producers do not.
What the Calendar Can Break or Confirm
Thursday’s economic calendar is dense enough to move the tape in either direction. The 8:30 AM ET release of initial jobless claims and the four-week moving average arrives first, and it matters more than usual this week. The Fed just told the market it may hike rates. Any upside surprise in claims — more Americans filing for unemployment — would validate the hold and reduce hike probability. A tight claims number would do the opposite, reinforcing the hawkish dot-plot signal and pressuring the 10-year yield higher.
The Philadelphia Fed Manufacturing Index hits simultaneously at 8:30 AM ET. The Philly Fed has been a reliable leading indicator for broader manufacturing sentiment, and with the Iran MOU now formally in place, there is a genuine question of whether the geopolitical relief translates into forward orders. A strong print — above consensus — would support the futures advance and add weight to the argument that the US economy is strong enough to absorb a rate hike without cracking. A miss reframes the whole day.
At 10:00 AM ET, the Leading Indicators month-over-month figure provides the broader macro context. This index has been negative or flat for much of the past year, and a turn higher would be significant — the kind of data point that gives Warsh’s task forces something concrete to work with. The EIA Natural Gas Report at 10:30 AM ET and the Baker Hughes Rig Count at 1:00 PM will close the loop on the energy complex, calibrating whether the crude selloff has follow-through or represents a one-day repricing of the Iran risk premium.
For the Fed communications picture, our earlier analysis of whether Warsh is walking into a market that has already decided remains directly relevant. The dot plot gap between the unanimous hold decision and the hike projections of nearly half the committee is the single most important unresolved tension in markets right now. Today’s data either validates the hawks or gives the doves ammunition to push back in the weeks ahead.
The Level That Matters Most Before the Bell
| Level / Event | Value | Signal |
|---|---|---|
| S&P 500 E-Mini Futures | 7,587.25 | Bullish pre-open; watch for hold above 7,581 intraday support |
| 10-Year Treasury Yield | 4.49% | Break above 4.55% after Philly Fed would compress equity gains fast |
| VIX | 18.44 | +12.37% overnight — close above 20 flags rally deterioration |
| Gold Spot | $4,304.85 | Rising gold alongside equities signals rate-hike hedge, not pure risk-on |
| WTI Crude Oil | $75.81 | -1.28%; Iran MOU premium unwinding — energy sector faces headwind today |
What This Morning’s Setup Actually Means for the Open
The honest read on Thursday’s premarket: this is a market in the middle of two narratives, not in possession of one. The Iran MOU is real, the geopolitical risk premium removal is real, and the Nikkei’s record close above 71,000 confirms that global equity markets are not in a defensive crouch. These are genuine tailwinds. Futures gains across all four major US indices confirm the directional bias heading into 9:30 AM.
But the VIX does not lie. A 12.37% overnight spike in volatility against a backdrop of rising futures is the market’s way of saying it is not entirely convinced. The Fed’s dot plot — nearly half the FOMC projecting a hike — lands differently when gold is at $4,304 and the 10-year yield is at 4.49%. That combination suggests a meaningful segment of the market is buying protection against a scenario where the Iran peace dividend fades faster than the rate-hike signal does.
For today’s session, the 8:30 AM data dump is the first real test. Strong jobless claims and a hot Philly Fed reading would validate the hawkish dot projections, pressure yields higher, and likely peel back some of the Nasdaq’s 1.32% pre-open gain — tech is the most rate-sensitive part of this market. Weak data does the opposite, extending the peace-rally logic and putting the VIX back toward 17. The range between those two outcomes is wide enough to make pre-market positioning feel premature. For a deeper look at how this rally connects to the broader ceasefire trade, see our analysis of whether this rally is built to last or just a peace dividend. The session opens with optimism in the air and a question mark in the data. That is not a comfortable place to add risk — but it rarely is when markets are right.
This article is published by PreMarket Daily for informational purposes only. Nothing here constitutes financial advice, investment recommendations, or an offer to buy or sell any securities. Always consult a qualified financial professional before making investment decisions.