
Overview:
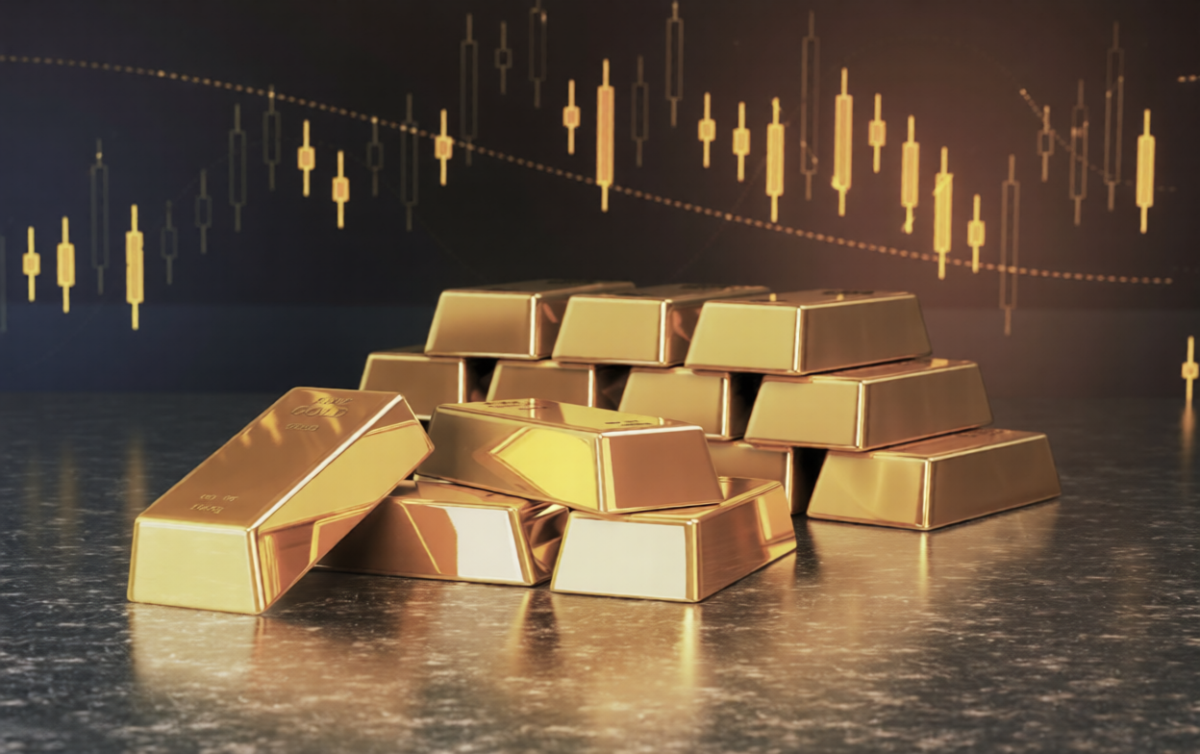
Gold is trading near $4,700 per ounce as the Iran war sustains safe-haven demand heading into the week of April 6. But the rally is not purely a geopolitical trade. Central bank accumulation running at roughly 60 tonnes per month, sustained de-dollarisation trends, and Goldman Sachs' end-2026 price target of $5,400 per ounce all point to structural forces that are independent of any single conflict's resolution. What the gold market is saying about broader investor sentiment deserves close attention.
Gold opened the week of April 6 trading in the $4,660–$4,715 per ounce range, adding 0.76% in pre-market trade as the Iran war’s Strait of Hormuz closure sustains demand for safe-haven assets. The precious metal has appreciated more than 50% over the past year, with analysts at Goldman Sachs maintaining an end-2026 price target of $5,400 per ounce. But investors who frame gold purely as a geopolitical hedge risk missing the deeper structural forces driving this market: central bank accumulation running at approximately 60 tonnes per month, an accelerating de-dollarisation trend across emerging market reserve managers, and a monetary policy backdrop in which real rates remain structurally lower than the nominal Treasury yield suggests. Gold this morning is not just a fear trade — it is a statement about confidence in the global financial architecture.
Gold Price April 2026: Reading the Numbers Behind the Rally
FX Leaders’ April 6 analysis notes that gold is holding in a tight range around $4,660–$4,670 per ounce with only modest intraday volatility — a relative calm that belies the extraordinary level at which the metal is trading. Earlier this year, gold briefly reached an all-time high near $5,477 per ounce before a partial pullback driven by easing diplomatic signals and profit-taking. The current level represents approximately a 19% discount to that peak, which long-term bulls argue represents a structural entry opportunity rather than evidence of a trend reversal.
The week of April 6–10 is expected to bring significant volatility to gold given the density of macro data — FOMC Minutes on Wednesday, PCE and Q4 GDP on Thursday, and Friday’s March CPI. LiteFinance’s gold forecast has mapped the April 6 trading range at $4,576–$4,760, with price movement in either direction described as equally plausible depending on data outcomes. A CPI print that confirms rapid headline inflation acceleration would tend to support gold’s real-asset appeal; a figure that surprises to the downside — suggesting energy costs have not yet fully transmitted — could temporarily weaken the safe-haven bid. Either way, the medium-term structural case remains intact.
Central Bank Demand and De-Dollarisation: The Structural Bid Under Gold
One of the most significant — and often underappreciated — forces sustaining gold’s multi-year bull market is the systematic accumulation of the metal by central banks, particularly those of emerging market economies. Central banks from emerging markets are purchasing gold at an estimated pace of approximately 60 tonnes per month in 2026, according to FX Leaders’ market analysis, translating to 755–850 tonnes annually for the full year. The People’s Bank of China has been building its gold reserves for 16 consecutive months, a trend that reflects not just a hedge against specific geopolitical events but a deliberate strategic shift in how reserve assets are denominated.
This de-dollarisation dynamic — the gradual movement away from U.S. dollar-denominated reserve assets by foreign central banks — has been one of the defining structural themes in global finance since 2022. Countries that had been effectively dormant gold buyers, including Malaysia and South Korea, have resumed increasing their reserves in recent months. The implication for prices is significant: central bank buying provides a persistent bid beneath the market that individual investor sentiment swings cannot easily dislodge. Even when Western physically backed gold ETFs saw approximately $11–12 billion in redemptions in March 2026, the structural buying from Asia and emerging market central banks partially offset those outflows and prevented a deeper pullback.
Gold vs. Equities vs. Treasuries: What the Cross-Asset Divergence Signals
The simultaneous behaviour of gold, U.S. equities, and Treasuries this morning is analytically instructive. Gold is up 0.76%. S&P 500 futures are modestly positive. The VIX is at 24.83, up approximately 4%. The 10-year Treasury yield is sitting at 4.313%. These four data points, read together, describe a market that is neither in full risk-off mode nor confidently risk-on. Investors are hedging across multiple dimensions — holding equities for the possibility of a geopolitical resolution and a relief rally, while maintaining safe-haven positions in gold for the scenario where the Iran situation deteriorates further. For a deeper understanding of how to interpret the pre-market environment, PreMarket Daily’s foundational guide provides the framework.
The relationship between gold and the 10-year Treasury yield is worth noting specifically. In theory, rising real yields are bearish for gold — a non-yielding asset becomes less attractive relative to income-generating Treasuries as rates rise. In practice, gold has held near $4,700 despite yields pushing back above 4.3%, which suggests the market is not treating Treasuries as a true safe haven in this environment. LiteFinance’s analysis notes that the probability of any Fed rate cut in April stands at 0% according to CME Group data — yet gold remains near historic highs. That decoupling from the traditional gold-rates relationship is itself a signal worth monitoring. To understand how futures across indices connect to broader macro signals, readers can explore PreMarket Daily’s futures explainer.
Risks to the Gold Thesis: What Could Challenge the Rally
A complete and honest analysis of the gold market requires acknowledging the conditions under which the current trajectory could reverse. The most significant near-term risk is a rapid geopolitical resolution — if the Strait of Hormuz reopens quickly following Trump’s Tuesday ultimatum, oil prices could fall sharply, inflation expectations would moderate, and the risk-off premium embedded in gold’s current price would partially unwind. This scenario would likely see a rotation back toward equities, with gold giving up some of its geopolitical premium while retaining the structural component supported by central bank buying and de-dollarisation.
A second risk is U.S. dollar strength. The dollar index has been under pressure, which has been supportive of gold — a stronger dollar makes dollar-denominated gold more expensive for international buyers and typically weighs on the price. Any macro data this week that significantly shifts Fed rate expectations hawkward — such as a CPI print that blows past 3.1% — could lift the dollar sharply and create a headwind for gold in the near term, even if the longer-term fundamental case remains intact. Third, the technical picture after a 50%+ twelve-month rally suggests the potential for profit-taking waves, particularly if headline risk momentarily subsides. For context on how the broader bull and bear market cycles interact with commodity performance, PreMarket Daily’s cycle guide provides relevant historical grounding. The Asian market overnight session also plays a role, given the scale of physical gold demand from the region.
The Bigger Picture: What Gold Is Really Telling Markets
Gold trading near $4,700 on a Monday morning when U.S. equities are attempting a modest recovery is not a contradiction — it is a signal. The metal’s structural bid reflects a sustained loss of confidence in the predictability of the macro environment: the dollar-based global financial order, the assumption that energy supply is frictionless, and the expectation that central bank policy can consistently manage inflation without growth cost have all been tested simultaneously in 2026. Whether this represents a permanent shift in the architecture of reserve assets or a temporary dislocation that normalises when geopolitical certainty returns is one of the defining analytical questions of the year. What can be said with confidence is that gold’s current behaviour is telling investors something important — and the weight of institutional money following that signal suggests the message is worth taking seriously.
Disclaimer: This article is published by PreMarket Daily for informational and educational purposes only. Nothing here constitutes financial advice. Always consult a qualified financial professional before making investment decisions.