
Overview:
The Federal Reserve is the most influential force in U.S. financial markets, with every FOMC rate decision sending ripple effects across equities, bonds, and currencies. This article explains how the Fed's dual mandate works, what tools it uses to manage inflation and growth, and what retail investors should monitor — from FOMC meeting dates and the dot plot to the CME FedWatch Tool — to stay ahead of Fed-driven market moves.
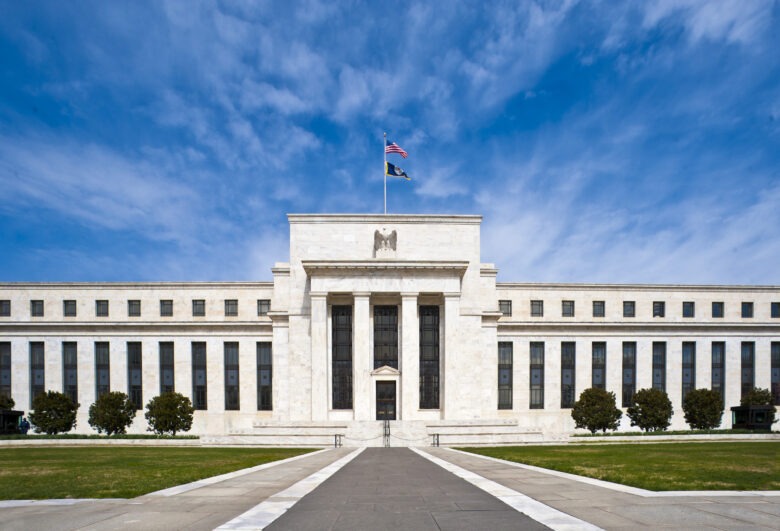
Of all the institutional forces that shape U.S. financial markets, few carry as much weight as the Federal Reserve. The central bank of the United States, the Fed is responsible for setting the monetary policy conditions that flow through every corner of the economy — from mortgage rates and business borrowing costs to equity valuations and currency markets. For retail investors, understanding how and why the Federal Reserve moves markets is not optional context — it is foundational knowledge for navigating the U.S. investment landscape.
What Does the Federal Reserve Do? The Fed’s Role in U.S. Financial Markets
The Federal Reserve was established in 1913 with a mandate to promote the stability of the U.S. financial system. Today, it operates under a dual mandate set by Congress: to achieve maximum employment and to maintain stable prices — generally interpreted as keeping inflation near a 2% annual target. The primary tool used to pursue these objectives is the federal funds rate — the benchmark interest rate at which banks lend reserves to one another overnight.
When the Fed raises interest rates, borrowing becomes more expensive across the economy, which tends to slow spending and investment — and by extension, inflation. When rates are cut, credit becomes cheaper, stimulating economic activity. The ripple effects of these decisions extend far beyond the banking system, directly influencing stock valuations, bond yields, the U.S. dollar, and commodity prices.
How Fed Interest Rate Decisions Move Stocks, Bonds, and the U.S. Dollar
The relationship between Federal Reserve policy and asset prices is one of the most studied dynamics in finance. In equity markets, interest rates affect stock valuations through the discounted cash flow (DCF) model — the framework most widely used to value businesses. When rates rise, the discount rate applied to future earnings increases, mechanically reducing the present value of stocks. Growth and technology stocks, whose valuations depend heavily on earnings projected far into the future, tend to be especially sensitive to rate increases.
In the bond market, the relationship is more direct: when the Fed raises rates, newly issued bonds offer higher yields, making existing lower-yield bonds less attractive and pushing their prices down. The inverse is true when rates fall. Meanwhile, a more hawkish Fed stance — signalling higher rates for longer — tends to strengthen the U.S. dollar, as higher yields attract foreign capital seeking better returns on dollar-denominated assets.
FOMC Meetings, the Dot Plot, and How to Read Fed Communications
Interest rate decisions are made by the Federal Open Market Committee (FOMC) — a 12-member body that meets eight times per year. Each meeting concludes with a policy statement outlining the committee’s decision and its economic rationale. Four of those eight meetings are followed by a press conference from the Fed Chair, providing additional context that markets scrutinize closely for signals about the future direction of rates.
One of the most closely watched outputs of FOMC meetings is the dot plot — a chart published quarterly that shows where each FOMC member expects interest rates to be at the end of the next several years. The dot plot is not a binding forecast, but it provides a transparent window into the committee’s collective thinking and is widely used by traders to calibrate expectations for future rate moves.
Beyond the dot plot, the Fed communicates through a range of channels including the Beige Book — a regional economic conditions report published eight times per year — as well as speeches by Fed governors and the Chair, which frequently move markets even when no formal policy decision is pending. Retail investors who monitor these channels gain advance visibility into the Fed’s evolving assessment of economic conditions.
How Retail Investors Can Position Ahead of Federal Reserve Decisions
Retail investors do not need to predict Fed decisions to benefit from understanding how monetary policy cycles affect different asset classes. During hawkish cycles — where the Fed is raising rates or signalling tightening — sectors such as Financials and Energy have historically held up better than rate-sensitive sectors like Utilities, Real Estate, and long-duration growth technology stocks.
Conversely, during dovish cycles — where rates are being cut or held low — growth stocks, real estate investment trusts (REITs), and long-duration bonds have tended to outperform. Understanding where the Fed sits in its policy cycle does not require market timing — it simply provides context for evaluating the risk profile of an existing portfolio and whether current sector exposures are well-aligned with the prevailing rate environment.
Monitoring the CME FedWatch Tool, FOMC meeting calendars, and key economic data releases — particularly the Consumer Price Index (CPI) and Non-Farm Payrolls — gives retail investors the same informational foundation that professional traders use to assess how monetary policy expectations are evolving in real time.
Conclusion
The Federal Reserve is arguably the single most consequential institutional actor in U.S. financial markets. Its decisions on interest rates, the communications it deploys around those decisions, and the economic conditions it responds to all have measurable, predictable effects across equities, bonds, currencies, and beyond. For retail investors, developing a working understanding of how the Fed operates — and how to read its signals — is one of the highest-value investments in financial literacy available.