
Overview:
The 10-year U.S. Treasury yield is the single most influential benchmark in global financial markets. This article explains how the yield is set, what forces move it, why rising and falling yields affect stock valuations differently across sectors, and how investors use real-time Treasury yield data as a pre-market signal alongside equity futures.
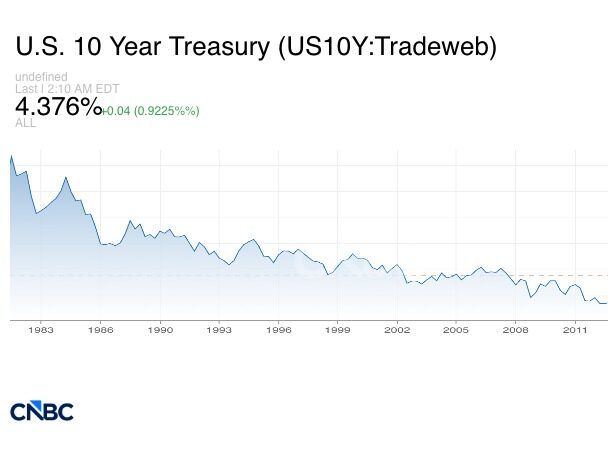
Among the dozens of economic indicators tracked by professional investors, the 10-year U.S. Treasury yield holds a uniquely central position. It is the benchmark against which mortgage rates, corporate borrowing costs, and equity valuations are measured. It reflects the market’s collective view on growth, inflation, and the long-term direction of monetary policy. And on any given morning, a meaningful move in the 10-year yield before the opening bell can shift the tone of the entire U.S. equity market. For investors who follow pre-market conditions, understanding the 10-year Treasury yield is not a niche fixed income topic — it is a core equity market skill.
What Is the 10-Year Treasury Yield? The U.S. Bond Market’s Most Watched Benchmark
A U.S. Treasury bond is a debt instrument issued by the federal government to finance its operations. When the government issues a 10-year Treasury bond, it promises to pay the bondholder a fixed interest rate — known as the coupon rate — every six months for 10 years, then return the principal at maturity. The yield, however, is not fixed — it fluctuates in the secondary market based on supply and demand for the bond.
When investors buy Treasury bonds in the open market, prices rise and yields fall. When investors sell, prices fall and yields rise. This inverse relationship between bond prices and yields is fundamental to understanding how fixed income markets work — and why a sell-off in the bond market can simultaneously signal higher yields and tighter financial conditions for the broader economy.
How the 10-Year Treasury Yield Is Set and What Moves It
Unlike the federal funds rate — which is set directly by the Federal Reserve — the 10-year Treasury yield is determined entirely by market forces. It reflects the collective judgment of global bond investors about where interest rates, inflation, and economic growth are headed over the coming decade. Three primary forces drive day-to-day movements in the 10-year yield.
Inflation expectations are the most powerful long-run driver. Because a fixed-rate bond loses purchasing power when inflation rises, investors demand a higher yield to compensate for that erosion. When the Consumer Price Index (CPI) or Personal Consumption Expenditures (PCE) data comes in hotter than expected, Treasury yields typically rise as traders reprice the inflationary outlook.
Federal Reserve policy signals are a secondary but immediate driver. When the Fed signals higher rates for longer — through the dot plot, FOMC statements, or Chair commentary — shorter-term Treasury yields respond most sharply, but the 10-year moves in sympathy. Conversely, signals of rate cuts or economic concern tend to push the 10-year yield lower as investors anticipate easier monetary conditions ahead.
Risk appetite and safe-haven demand also play a significant role. During periods of market stress or geopolitical uncertainty, investors rotate into U.S. Treasuries as a safe-haven asset, pushing prices up and yields down. This flight-to-quality dynamic means the 10-year yield often falls precisely when equity markets are under pressure — a relationship that investors can use as a real-time cross-market signal.
Why Stock Markets React to Rising and Falling Treasury Yields
The connection between the 10-year Treasury yield and U.S. stock markets operates through several distinct channels — each of which affects different parts of the equity market with varying intensity.
The most direct channel is the discounted cash flow (DCF) valuation model. In this framework, a company’s intrinsic value is calculated by discounting its projected future cash flows back to the present using a rate that incorporates the risk-free rate as its foundation. When the 10-year yield rises, the discount rate rises, and the present value of future earnings falls — mechanically reducing stock valuations. Growth stocks and technology companies, whose value is disproportionately derived from earnings projected many years into the future, are most acutely affected by this dynamic.
A second channel is the competition for capital. When the 10-year yield is near 5%, a U.S. government bond offers a compelling risk-free return that competes directly with equity dividend yields and projected stock returns. At those levels, some institutional investors — particularly pension funds and insurance companies with liability-matching mandates — will shift allocations from equities to Treasuries, reducing demand for stocks.
A third, more nuanced channel is the signal the yield sends about economic growth expectations. A rising 10-year yield driven by strong growth and improving economic conditions can actually be positive for cyclical stocks — Financials, Industrials, and Energy — even as it pressures high-multiple growth names. The source of the yield move matters enormously in determining how different equity sectors will respond.
How Investors Use the 10-Year Yield as a Pre-Market Signal
Because the U.S. Treasury market trades around the clock, the 10-year yield is one of the first data points professional investors check in pre-market hours. A significant overnight move — driven by foreign central bank activity, geopolitical developments, or an unexpected economic data release from a major economy — can shift the pre-market tone for equities before a single U.S. stock has traded.
Investors monitor the 10-year yield alongside equity index futures to assess whether the two are moving in alignment or diverging. A rising yield accompanied by rising futures may signal a growth-optimism trade; a rising yield paired with falling futures more likely reflects inflation concern or tightening financial conditions — a meaningfully different market environment with different sector implications.
The yield curve — particularly the spread between the 2-year and 10-year Treasury yields — provides additional context. An inverted yield curve, where the 2-year yield exceeds the 10-year, has historically been one of the most reliable leading indicators of economic recession, and its shape is closely monitored by institutional investors as a macro risk gauge alongside day-to-day yield levels. Real-time Treasury yield data is freely available through the U.S. Department of the Treasury and financial data platforms including CNBC Markets and Financial Times Markets.
Conclusion
The 10-year U.S. Treasury yield is far more than a fixed income metric — it is one of the most powerful cross-market signals in global finance. Its influence on equity valuations, sector rotation, mortgage rates, and the broader cost of capital makes it a daily reference point for investors at every level of sophistication. For those who engage with pre-market data, developing an intuition for how and why the 10-year yield moves — and what those moves mean for different parts of the stock market — is an essential component of informed market analysis.