
Overview:
The VIX — formally known as the CBOE Volatility Index — is Wall Street's most widely cited measure of expected stock market volatility. Often called the "Fear Index," the VIX rises when investor anxiety increases and falls during periods of calm. This article explains how the VIX is constructed, what its readings signal, and how professional and retail investors incorporate it into risk management strategies.
In the world of U.S. equity markets, few indicators attract as much attention during periods of turbulence as the VIX. Formally known as the CBOE Volatility Index, the VIX is a real-time measure of the market’s expectation of near-term volatility in the S&P 500. Widely referred to as the “Fear Index” or “Fear Gauge,” it tends to spike sharply during market sell-offs and compress during sustained rallies. For investors seeking to assess broader market sentiment, the VIX is one of the most important data points available.
What Is the VIX Index? Understanding the CBOE Volatility Index
The VIX was introduced by the Chicago Board Options Exchange (CBOE) in 1993 and updated to its current methodology in 2003. It measures the market’s expectation of volatility in the S&P 500 over the next 30 days, expressed as an annualized percentage. A VIX reading of 20, for example, implies that the market expects the S&P 500 to move approximately 20% — up or down — on an annualized basis over the coming month.
Unlike a stock index that tracks prices, the VIX is a forward-looking measure derived entirely from options prices. It is not directly investable in its raw form, though a range of VIX-linked exchange-traded products allow investors to gain exposure to volatility as an asset class.
How Is the VIX Calculated? S&P 500 Options and Implied Volatility Explained
The VIX is calculated using the real-time prices of a broad range of S&P 500 options contracts — both calls and puts — spanning a wide range of strike prices. Rather than relying on a single model-based estimate, the CBOE’s methodology aggregates implied volatility across many strikes to produce a more robust, model-free reading of market expectations.
The calculation incorporates options expiring in the two nearest monthly cycles that bracket the 30-day target horizon, weighting them to arrive at a consistent 30-day implied volatility figure. The result is then annualized and expressed as a percentage. When options traders are paying high premiums for downside protection — such as put options — implied volatility rises, pushing the VIX higher.
The long-run historical average of the VIX is approximately 19–20. Since the index’s inception, it has closed above 30 — a threshold widely associated with elevated fear — on roughly 15% of all trading days, most of which coincided with major market dislocations such as the 2008 financial crisis, the 2020 COVID-19 shock, and the 2022 rate-hike cycle.
What VIX Levels Mean: Reading Low, High, and Extreme Fear Signals
Market practitioners generally interpret VIX levels within a set of broad ranges, though no threshold is absolute and context always matters.
A VIX below 15 is typically associated with low investor anxiety, stable economic conditions, and a broadly risk-on market environment. Historically, such readings have coincided with extended bull market phases. A VIX between 15 and 25 reflects moderate uncertainty — the range in which markets spend the majority of time. Readings above 30 are associated with significant stress, and levels above 40 — seen during crisis periods — indicate extreme fear and widespread risk aversion.
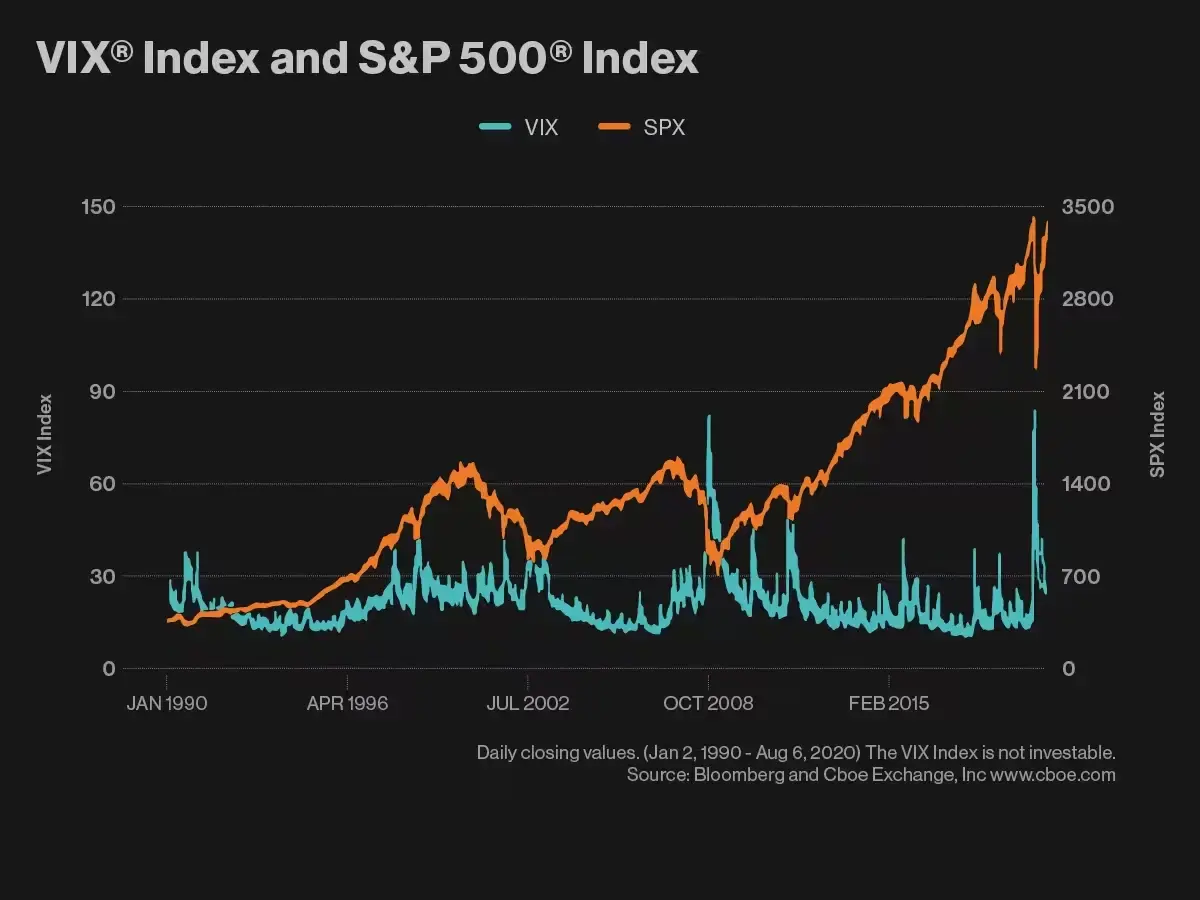
During the March 2020 market crash triggered by the COVID-19 pandemic, the VIX surged to an intraday high of 85.47 on March 18, 2020 — its highest recorded level — surpassing even the 80.86 peak reached during the depths of the 2008 global financial crisis./span>
It is worth noting that the VIX exhibits a well-documented tendency to mean-revert. Extreme spikes — even during severe market events — are typically followed by a gradual compression as uncertainty subsides. This dynamic has important implications for how volatility-linked instruments are structured and traded.
How Investors Use the VIX Fear Index to Manage Portfolio Risk
Professional investors and portfolio managers incorporate the VIX into their frameworks in several ways. One of the most common uses is as a hedging signal. When the VIX is at historically low levels, the cost of purchasing protective options — such as put options on the S&P 500 — is relatively inexpensive. Some managers use these periods to build tail-risk hedges ahead of anticipated volatility.
The VIX is also used as a contrarian sentiment indicator. Because extreme fear readings have historically preceded market recoveries — rather than sustained further declines — some investors interpret a VIX above 40 as a potential signal that panic selling may be reaching exhaustion. This is a probabilistic view, not a guarantee, and requires careful integration with other fundamental and technical signals.
Institutional traders also monitor the VIX term structure — the relationship between short-dated and longer-dated volatility expectations — as an indicator of whether fear is acute and near-term, or more broadly distributed across time horizons. A steeply inverted VIX term structure, where near-term implied volatility exceeds longer-term levels, often signals acute market stress.
Conclusion
The VIX remains one of the most powerful and widely followed gauges of market sentiment available to investors. Whether used as a risk management tool, a hedging trigger, or a contrarian signal, understanding what the Fear Index measures — and what its limitations are — is essential context for navigating volatile equity markets. As with any single indicator, the VIX is most valuable when read alongside a broader set of macroeconomic, technical, and fundamental signals.